

The decathlon consists of 10 events including the pole vault.
The decathlon consists of ten track and field events spread over two days. It is the most physically demanding event for athletes. On day one, the 100 metres, long jump, shot putt, high jump and 400 metres are contested. On day two, the competitors face the 110 metre hurdles, discus, pole vault, javelin and, finally, the 1500 metres. In order to combine the results of these very different events -- some give times and some give distances -- a points system has been developed. Each performance is awarded a predetermined number of points according to a set of performance tables. These are added, event by event, and the winner is the athlete with the highest points total after ten events.
The most striking thing about the decathlon is that the tables giving the number of points awarded for different performances are rather free inventions. Someone decided them back in 1912 and they have subsequently been updated on different occasions. Clearly, working out the fairest points allocation for any running, jumping or throwing performance is crucial and defines the whole nature of the event very sensitively. Britain's Daley Thompson missed breaking the decathlon world record by one point when he won the Olympic Games 1984 but a revision of the scoring tables the following year increased his score slightly and he became the new world record holder retrospectively!
All of this suggests some important questions that bring mathematics into play. What would happen if the points tables were changed? What events repay your training investment with the greatest points payoff? And what sort of athlete is going to do best in the decathlon -- a runner, a thrower or a jumper?
The decathlon events fall into two categories: running events where the aim is to record the least possible time and throwing or jumping events where the aim is to record the greatest possible distance. The simplest way of scoring this would be to multiply all the throw and jump distances in metres together, then multiply all the running times in seconds together and divide the product of the throws and jumps by the product of the running times. The Special Total, $ST$, will be $$ ST=\frac{LJ\times HJ\times PV\times JT\times DT\times SP}{T_{100m} \times T_{400m}\times T_{110mH}\times T_{1500m}} $$ where $LJ$ is the distance from the long jump, $HJ$ the high jump, $JT$ the javelin, $DT$ the discus and $SP$ the shot putt, with units of $$ \frac{(length)^6}{(time)^4} = \frac{m^6}{s^4}. $$
If we take the three best ever decathlon performances by Ashton Eaton (9039 pts), Roman Šebrle (9026 pts) and Tomáš Dvořák (8994 pts) and work out the Special Totals for the 10 performances they each produced then we get
$$ \begin{array}{rl} \mbox{Šebrle (9026 pts):} & ST = 2.29 \\ \mbox{Dvořák (8994 pts):} & ST = 2.40 \\ \mbox{Eaton (9039 pts):} & ST = 1.92 \end{array} $$Interestingly, we see that the second best performance by Dvořák becomes the best using this new scoring system and Eaton's drops to third.
In fact, our new scoring system contains some biases. Since the distances attained and the times recorded are different for the various events you can make a bigger change to the ST score for the same effort. An improvement in the 100 metre from 10.6 seconds to 10.5 seconds requires considerable effort but you don't get much of a reward for it in the ST score. By contrast reducing a slow 1500 metre run by 10 seconds has a big impact. The events with the room for larger changes have bigger effects on the total.
The setting of the points tables that are used in practice is a technical business that has evolved over a long period of time. It pays attention to world records, the standards of the top ranked athletes, and historical decathlon performances. However, ultimately it is a human choice and if a different choice was made then different points would be received for the same athletic performances and the medallists in the Olympic Games might be different. The 2001 IAAF scoring tables have the following simple mathematical structure.
The points awarded (decimals are rounded to the nearest whole number to avoid fractional points) in each track event -- where you want to give higher points for shorter times -- are given by the formula:
$$ A\times (B-T)^C $$where $T$ is the time recorded by the athlete in a track event and $A$, $B$ and $C$ are numbers chosen for each event so as to calibrate the points awarded in an equitable way. The quantity $B$ gives the cut-off time at and above which you will score zero points. $T$ is always less than $B$ in practice -- unless someone falls over and crawls to the finish!
For the jumps and throws -- where you want to give more points for greater distances ($D$) -- the points formula for each event is
$$ A\times (D-B)^C. $$You score zero points for a distance equal to or less than $B$. The distances here are all in metres and the times in seconds. The three numbers $A$, $B$ and $C$ are chosen differently for each of the ten events and are shown in the table below.
The points achieved for each of the ten events are then added together to give the total score.
| Event | A | B | C |
|---|---|---|---|
| 100 m | 25.4347 | 18 | 1.81 |
| Long jump | 0.14354 | 220 | 1.4 |
| Shot put | 51.39 | 1.5 | 1.05 |
| High jump | 0.8465 | 75 | 1.42 |
| 400 m | 1.53775 | 82 | 1.81 |
| 110 m hurdles | 5.74352 | 28.5 | 1.92 |
| Discus throw | 12.91 | 4 | 1.1 |
| Pole vault | 0.2797 | 100 | 1.35 |
| Javelin throw | 10.14 | 7 | 1.08 |
| 1500 m | 0.03768 | 480 | 1.85 |
In order to get a feel for which events are "easiest" to score in, take a look at this table which shows what you would have to do to score 900 points in each event for an Olympic-winning 9000-point total alongside Ashton Eaton's world record.
| Event | 900 pts | 9039 (Eaton, World Record) |
|---|---|---|
| 100m | 10.83s | 10.21s |
| Long jump | 7.36m | 8.23m |
| Shot put | 16.79m | 14.20m |
| High jump | 2.10m | 2.05m |
| 400m | 48.19s | 46.70s |
| 110m hurdles | 14.59s | 13.70s |
| Discus throw | 51.4m | 42.81m |
| Pole vault | 4.96m | 5.3m |
| Javelin throw | 70.67m | 58.87m |
| 1500m | 247.42s (= 4m 07.4s) | 254.8s (= 4m 14.8s) |
There is an interesting pattern in the formulae that change the distances and times achieved into points for the decathlon. The power index $C$ is approximately 1.8 for the running events (1.9 for the hurdles), close to 1.4 for the jumps and pole vault and close to 1.1 for the throws. The same pattern holds for the women's heptathlon as well, with $C$ approximately equal to 1.8 for runs, 1.75 for jumps and 1.05 for throws. The fact that $C > 1$ indicates that the points scoring system is a ''progressive'' one, curving upwards in a concave way with decreasing time or increasing distance; that is, the better the performance, the higher the reward for performance improvements (see figure 1).
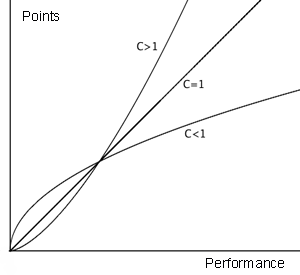 Figure 1: Illustration of the increase in points gained for improved performances in progressive (C > 1), neutral (C = 1), and regressive (C < 1) scoring systems.
This is realistic. We know that as you get more expert at your event it gets harder to make the same improvement but beginners can easily make large gains. The opposite type of ("regressive") points system would have $C < 1$, curving increasingly less, while a "neutral" one would have $C = 1$ and be a straight line. We can see that the IAAF tables are very progressive for the running events, fairly progressive for the jumps and vault, but almost neutral for the throws.
It is clear that there has been a significant bias towards gathering points in the long jump, hurdles and sprints (100m and 400m). Performances in these events are all highly correlated with flat-out sprinting speed. Conversely, the 1500m and the three throwing events are well behind the other disciplines in points scoring. If you want to coach a successful decathlete, start with a big strong sprint hurdler and build up strength and technical ability for the throws later. No decathletes bother much with 1500m preparation and rely on general distance running training. Ideally, we would expect there to be very little variance in this bar chart as we go from one event to another. In reality, the variations are huge and the scoring system is rather biased towards sprinter-jumpers. The women's heptathlon has a similar bias in its scoring tables, which greatly favours athletes like Jessica Ennis.
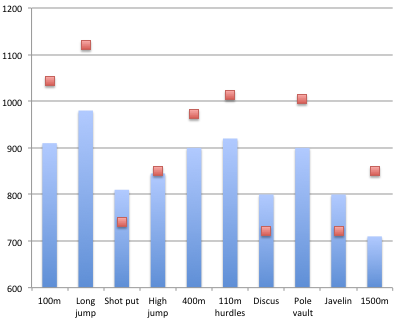
Figure 2 shows the division between the ten events for the averages of the all-time top 100 best ever men's decathlon performances.
What if we picked $C = 2$ across all events? This would give an extremely progressive scoring system greatly favouring competitors with outstanding performances in some events (like Eaton), as opposed to those with consistent similar ones. However, it would dramatically favour good throwers over the sprint hurdlers because of the big change from the value of $C = 1.1$ being applied to the throws at present. And this illustrates the basic difficulty with points systems of any sort -- there is always a subjective element that could have been chosen differently.
Related resources
Our Key Stage 4 activity Training Schedule looks at the maths behind the heptathlon scoring system.