-

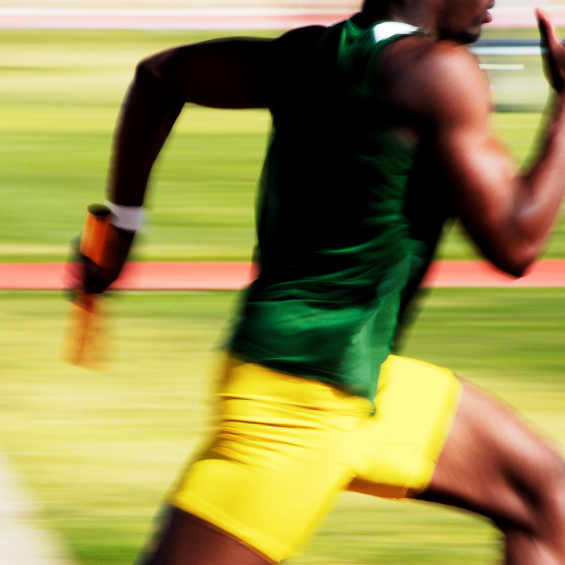
Can you work out which Olympics athletics event each anonymised graph of Olympic records data represents? This activity, aimed at Key Stage 3 (age 11-14), gives students the opportunity to make sense of graphical data and challenges them to apply their own knowledge about athletics to explain and interpret key features of the graphs.
-
Never afraid of a challenge, before the start of the London 2012 Games we issued predictions for the total medal count for the top 20 countries. They were based on a mathematical model that took account of a country's GDP and population, its performance in 2008 and the home advantage bestowed on Great Britain and also China, who hosted the Games in 2008 (see Mapping the medals). So how did we do?
-
In our article Mapping the Medals we've put our money where our mouth is and predicted the final 2012 London Olympic medal count for the top 20 countries. Will we be right? See the predictions, and track how we're doing, with this interactive medals map, updated daily during the 2012 Games!
-

Who'll be the winner in the final medal tally at London 2012? Sport, with all its intricacies and vagaries, is always susceptible to variations in form, weather conditions and simple random events. But we like a challenge! So here is our predicted 2012 London Olympic medal count - and you can track how we're doing with our interactive medals map, updated daily during the Games.
-

How does Olympic success correlate with a nation’s GNP? How does the location of the Olympics affect the chance of record breaking? And how can simple statistics help us understand the likelihood of winning streaks and the chance that an innocent athlete will fail a drugs test? Professor John Barrow explores the answers in this video lecture, aimed at a general audience.
-
Who won in these different events? This is a more challenging activity for primary pupils at Key Stage 1, which helps children understand why sometimes the winner has the biggest number and sometimes the smallest.
-
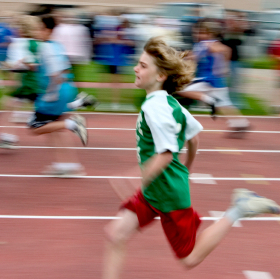
Take a look at the amazing limits that athletes push themselves to in search of Olympic glory. Which events see the fastest speeds, furthest distances and highest forces? This activity challenges students to undertake some research, calculate with measurements and different units, and make comparisons, and has a number of different parts aimed at students across both Key Stages 4 and 5.
-

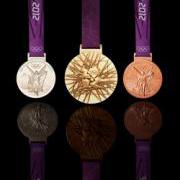
Who could have won the gold, silver and bronze medals? This activity is designed to be accessible to primary pupils at Key Stage 1.
-

Looking at the 2012 Olympic Medal table, can you see how the data is organised? Could the results be presented differently to give another nation the top place? This activity encourages children to develop their skills in data analysis, and is designed to be accessible to primary pupils at Key Stage 2.
-
Play our sporty card game with 24 cards featuring information about Olympic athletes past and present. This game is aimed at primary school pupils at Key Stages 1 and 2.
© 2013 University of Cambridge